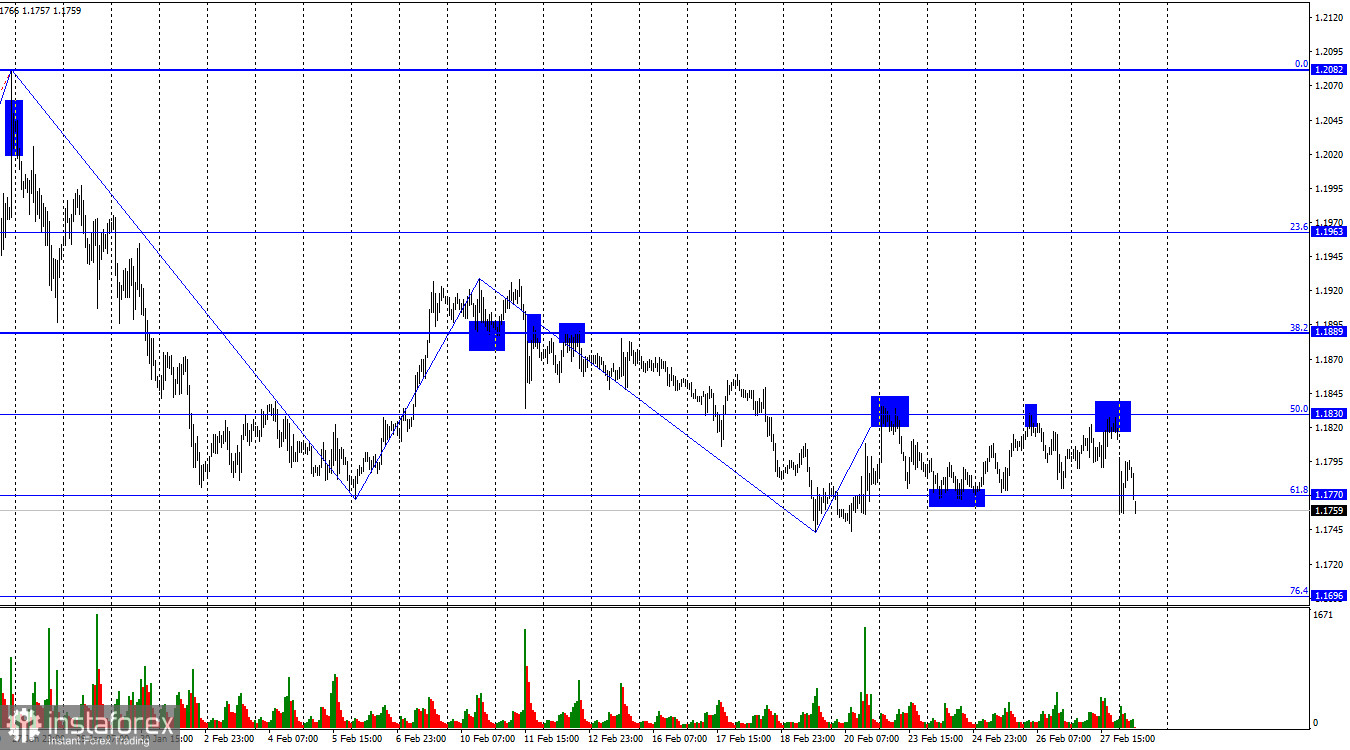
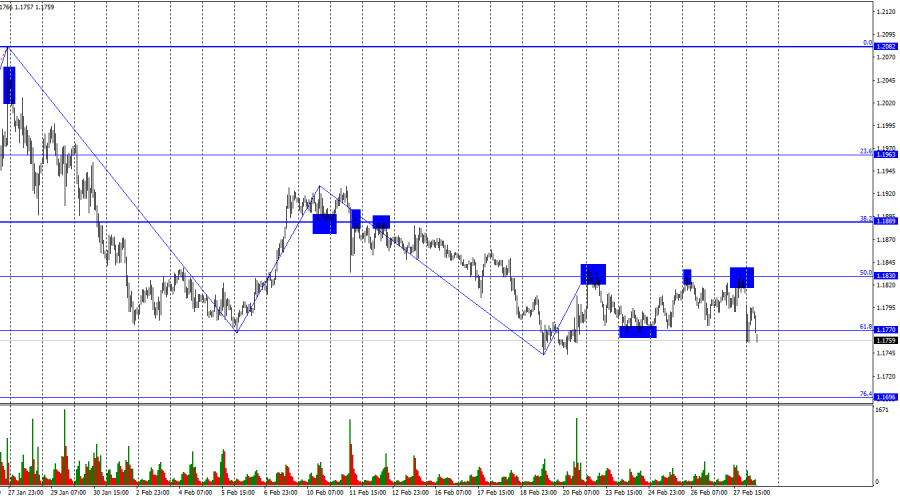
During Friday, the EUR/USD pair posted another rise to the 50.0% Fibonacci corrective level at 1.1830, rebounded from it, and reversed in favor of the U.S. dollar. After the weekend events in the Middle East, bears launched a new offensive. The dollar is rising rapidly, and the pair has already closed below the 61.8% Fibonacci level at 1.1770. Thus, the decline may continue toward the next corrective level of 76.4% at 1.1696 and further to 1.1578.
The wave situation on the hourly chart remains simple. The last completed upward wave failed to break the previous peak, and the new downward wave has not yet broken the previous low. Therefore, the trend remains bearish. Bulls have taken a pause within what had been a large-scale offensive, which would have been impossible without Donald Trump. However, it is precisely Donald Trump's actions in the Middle East—actions that provoked large-scale military operations involving nearly a dozen states—that are now working in favor of the U.S. currency.
On Friday, the news background for both the euro and the dollar was relatively weak, but by Monday morning it had completely lost significance. I believe everyone understands why the dollar is rising and why the market is aggressively selling EUR/USD. A new war has begun in the world, already involving Israel, the United States, Iran, Kuwait, Qatar, Bahrain, the UAE, and Saudi Arabia. Strikes are being carried out in all directions. Iran's leader, Ali Khamenei, has been killed, the Strait of Hormuz has been closed, and financial markets experienced a real shock over the weekend, although most traders and investors had anticipated such a development. However, many expected only a U.S. military operation in Iran, possibly with Israeli participation. Yet by the second day of the war, nine countries were already involved. What could stop the hostilities remains unclear. The death of Iran's ayatollah has not led to a change in political course. Iran is striking not only the U.S. fleet in the Persian Gulf, but also American military bases and other allied facilities.
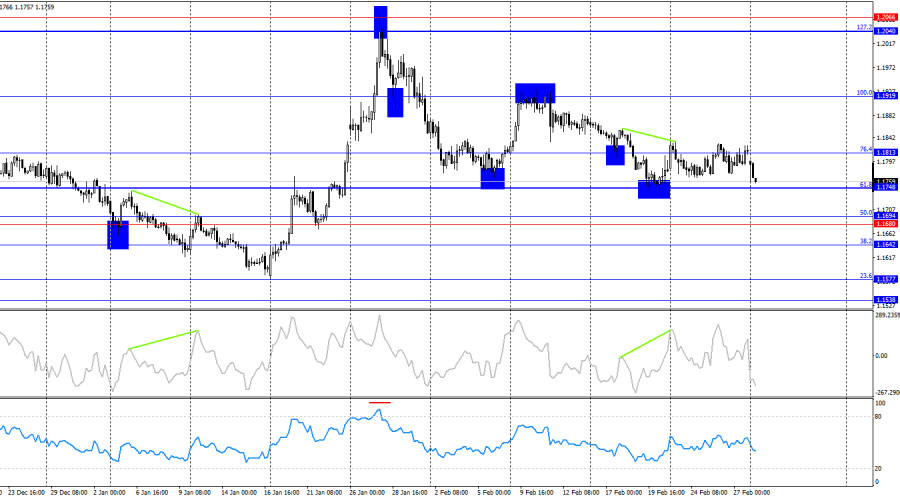
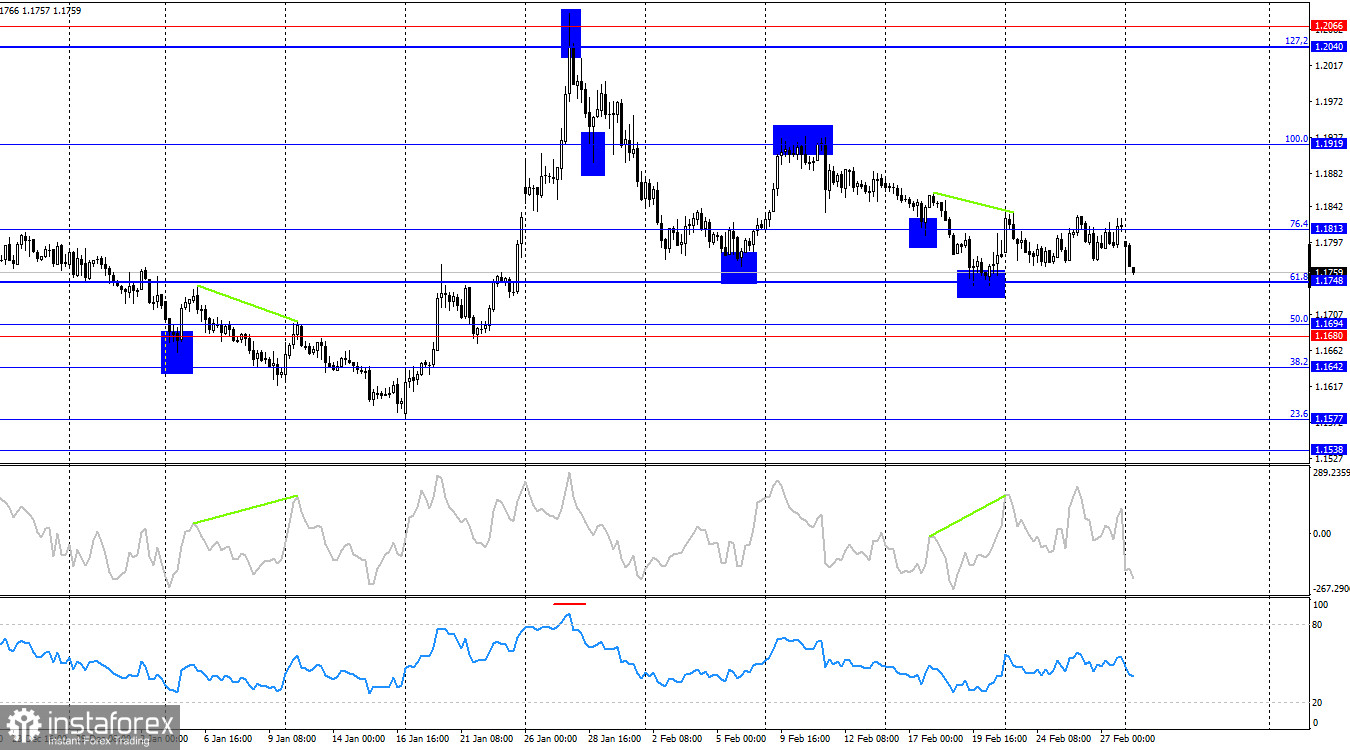
On the 4-hour chart, the pair reversed in favor of the U.S. dollar after a bearish divergence formed on the CCI indicator, and the events in Iran pushed the price down to the 61.8% Fibonacci level at 1.1748. A rebound from this level could allow for some growth, but given the situation in the Middle East, a consolidation below 1.1748 and further decline toward 1.1694 and 1.1642 appears more likely. No new emerging divergences are observed on any indicator.
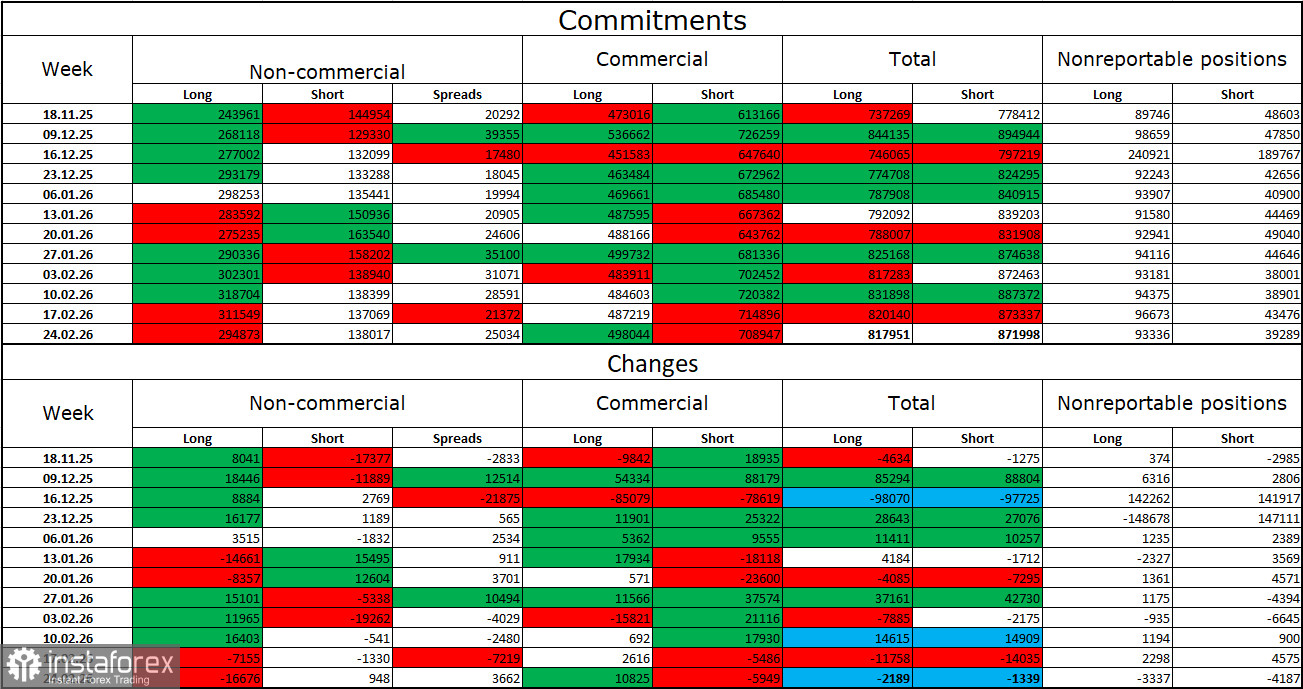
Commitments of Traders (COT) Report:
During the latest reporting week, professional traders closed 16,676 Long positions and opened 948 Short positions. The sentiment of the "Non-commercial" group remains bullish thanks to Donald Trump and his policies, but in recent weeks we have seen a reduction in Long positions. The total number of Long positions held by speculators now stands at 294,000, while Short positions amount to 138,000. The bulls' advantage remains more than twofold.
Overall, in the long term, major players continue to reduce Short positions and increase Long positions. Undoubtedly, various global events—of which there has been no shortage in recent years—affect investors in different ways. At present, all market attention is focused on the Middle East, where the war continues to escalate and expand geographically. Thus, in the near term, the euro and dollar exchange rate will depend not on Donald Trump's policies, but on the war in Iran.
News Calendar for the U.S. and the European Union:
- European Union – Change in German retail sales (07:00 UTC).
- U.S. – ISM Manufacturing PMI (15:00 UTC).
On March 2, the economic calendar contains two entries, of which only the ISM index is significant. The information background will influence market sentiment on Monday, also due to geopolitical developments.
EUR/USD Forecast and Trading Advice:
Short positions were possible after a rebound from 1.1830 on the hourly chart, targeting 1.1770 and 1.1696. The first target has been reached, and price is moving toward the second. I would not recommend considering long positions under current circumstances.
Fibonacci retracement grids are built from 1.1805–1.1578 on the hourly chart and from 1.1919–1.1471 on the 4-hour chart.