Analysis of Monday's Trades:
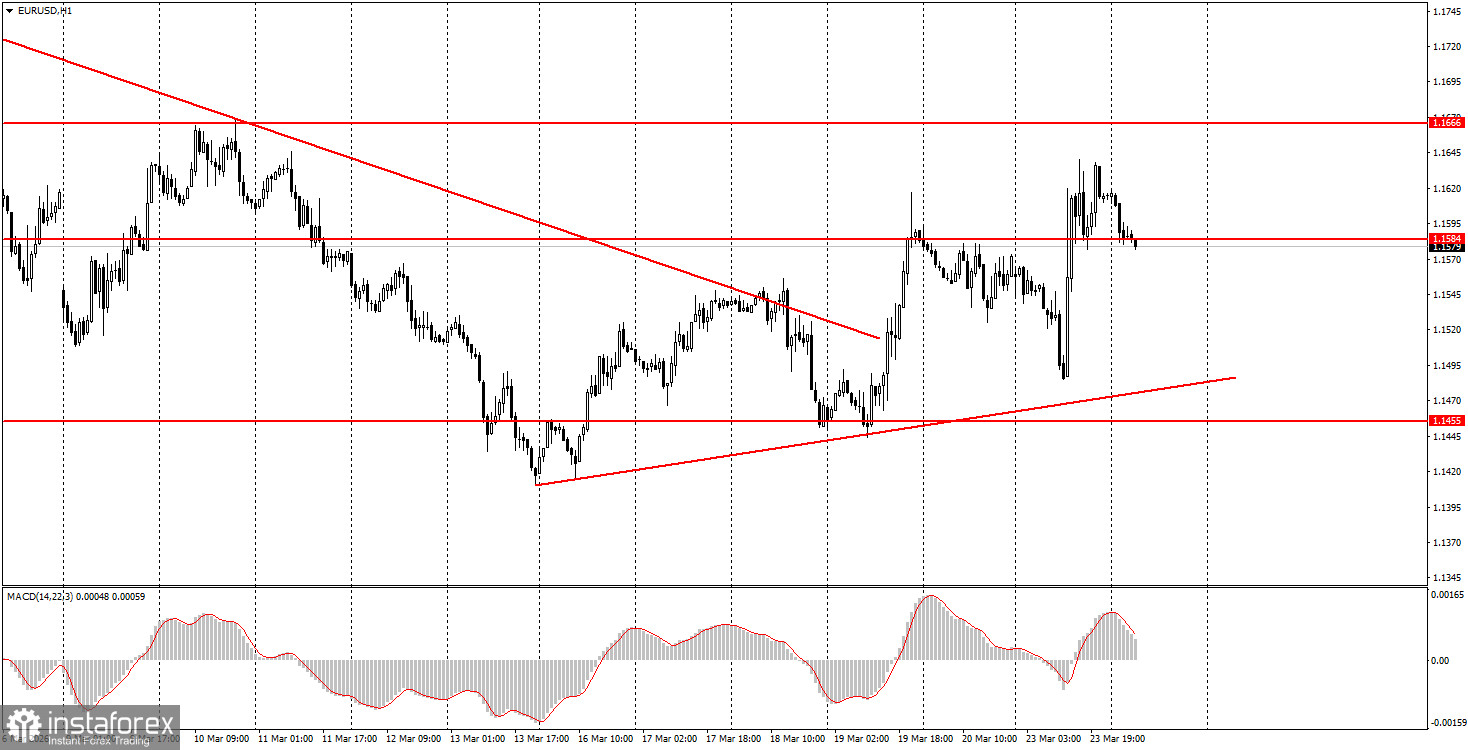
1H Chart of the EUR/USD Pair
On Monday, the EUR/USD currency pair intended to resume its downward movement under the pressure of the geopolitical conflict in the Middle East, but then... Donald Trump announced that negotiations with Iran are yielding results and that the war may end soon. The dollar immediately came under pressure following the de-escalation of the military conflict, but just half an hour later, Iranian officials completely denied the existence of any negotiations. It's hard to say who to believe, but the market believed the US president. If not 100%, then at least 70-80%. Trump's message suggests that even if there are actually no negotiations, he is open to them. In other words, America wants to end the conflict, but will Iran comply? On the one hand, Tehran is unlikely to be interested in a prolonged military conflict. On the other hand, it is prepared for one. Thus, it must at least stop the bombings of Iran for combat operations to cease. After that, discussions could begin to unblock the Strait of Hormuz and restore the region's energy infrastructure.
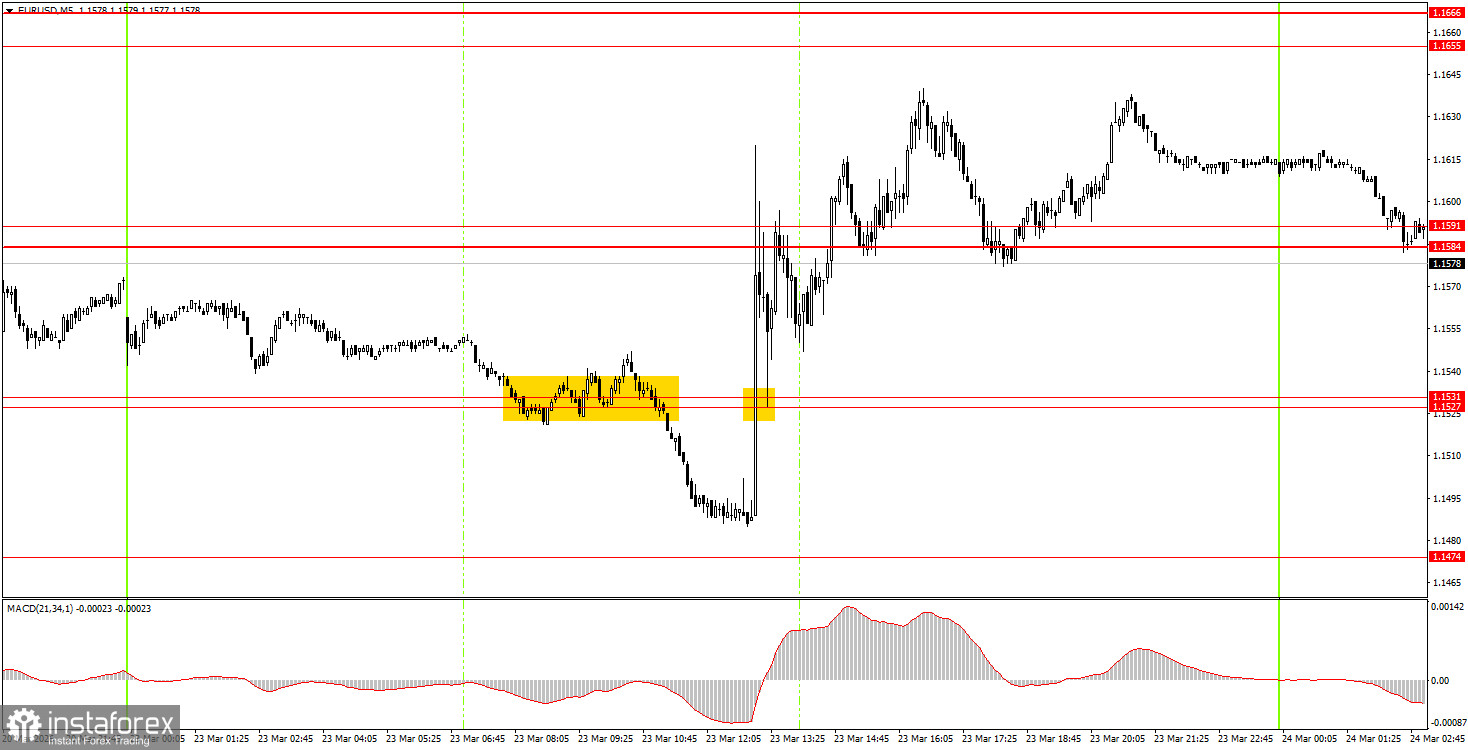
5M Chart of the EUR/USD Pair
On the 5-minute timeframe on Monday, the pair formed a decent sell signal during the European trading session. The price broke through the 1.1527-1.1531 area and dropped by about 30 pips. Then came Trump's announcement, and the price traded with hyper-volatility for the rest of the day, constantly changing direction and ignoring technical levels. Thus, the remaining trading signals could have easily been overlooked by novice traders.
How to Trade on Tuesday:
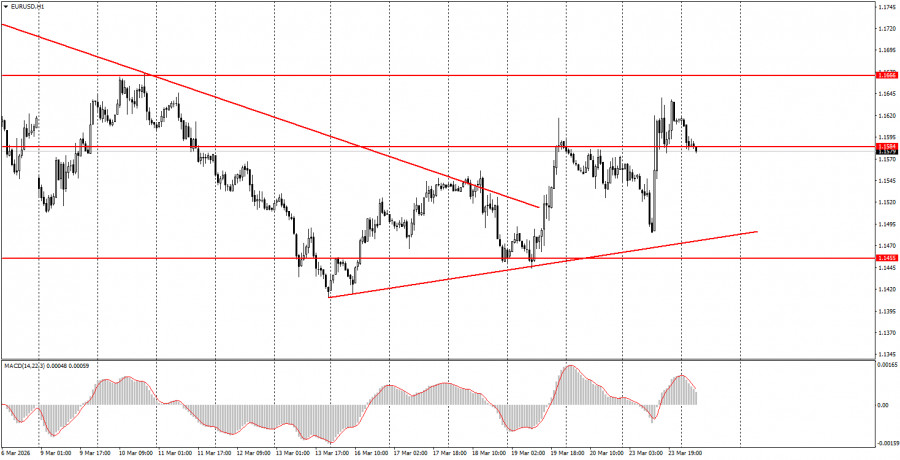
On the hourly timeframe, the downward trend is complete, but we may be dealing with yet another simple upward correction. At the beginning of 2026, a long-term upward trend resumed, so we still anticipate new medium-term growth for the euro currency. The overall fundamental background remains very challenging for the US dollar; however, geopolitical factors are currently of primary importance for the market. This is what prevents the dollar from falling.
On Tuesday, beginner traders may consider short positions if the price consolidates below the 1.1584-1.1591 range, targeting 1.1527-1.1531. A bounce from the area of 1.1584-1.1591 would allow for opening long positions with targets of 1.1655-1.1666.
On the 5-minute timeframe, the following levels should be monitored: 1.1267-1.1292, 1.1354-1.1363, 1.1413, 1.1455-1.1474, 1.1527-1.1531, 1.1584-1.1591, 1.1655-1.1666, 1.1745-1.1754, 1.1830-1.1837, 1.1899-1.1908. On Tuesday, business activity indices for March will be published in the Eurozone and the US, which may have a moderate impact on the movement of the currency pair. The market's focus will again be directed toward geopolitics and Trump's speeches.
Key Principles of the Trading System:
- The strength of a signal is determined by the time it takes to form the signal (bounce or breakout). The less time taken, the stronger the signal.
- If two or more trades have been opened at a particular level based on false signals, all subsequent signals from that level should be ignored.
- In a flat market, any pair can form many false signals or none at all. In any case, at the first signs of a flat trend, it is best to stop trading.
- Trading deals are to be opened during the period between the start of the European session and the mid-American session, after which all trades should be closed manually.
- On the hourly timeframe, it is preferable to trade based on signals from the MACD indicator only when there is good volatility and a trend confirmed by a trend line or trend channel.
- If two levels are positioned too close together (5-20 pips apart), they should be considered a support or resistance area.
- Upon moving 15 pips in the correct direction, a Stop Loss should be set to breakeven.
What to Look for on the Charts:
Price levels of support and resistance are levels that serve as targets when opening buys or sells. Take Profit levels can be placed around them.
Red lines represent channels or trend lines that show the current trend and indicate the direction in which it is preferable to trade now.
The MACD indicator (14,22,3) – the histogram and the signal line – is a supporting indicator that can also be used as a source of signals.
Important speeches and reports (always included in the news calendar) can significantly affect the movement of the currency pair. Therefore, during their release, trading should be done with utmost caution, or traders should exit the market to avoid sharp price reversals against the previous movement.
Beginning traders in the forex market should remember that not every trade can be profitable. Developing a clear strategy and effective money management are the keys to long-term trading success.